
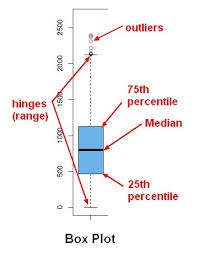
One of the first steps in analysing a dataset is the Data Exploration. The box plots is a standardized way of displaying the distribution of data. Boxplots gives information about the minimum, first quartile, median, third quartile, and maximum.
In this short post, I will focus on the vizualization of the data and the outliers using BoxPlot. To learn more on Data Exploration, check this very thorough post .
I will be using data from an assignment of the Machine Learning Nanodegree: customer segmentation. The dataset is made of 400 businesses: restaurants, retailers, etc…, with their purchasing pattern for Milk products, Grocery products, and more…
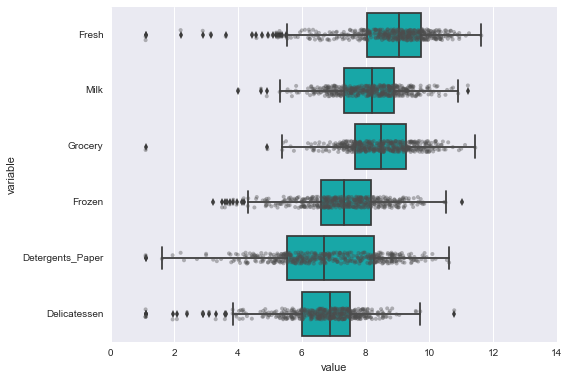
You can also check out this post where Matplotlib was used to generate the boxplots. link