Intro to Hough Transform
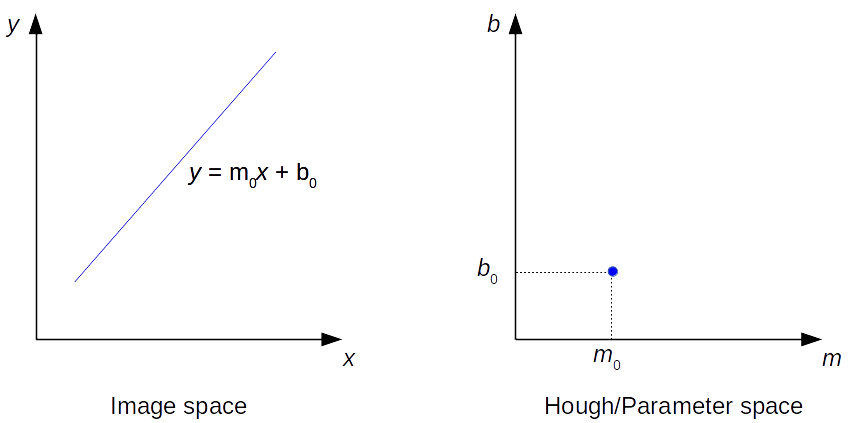
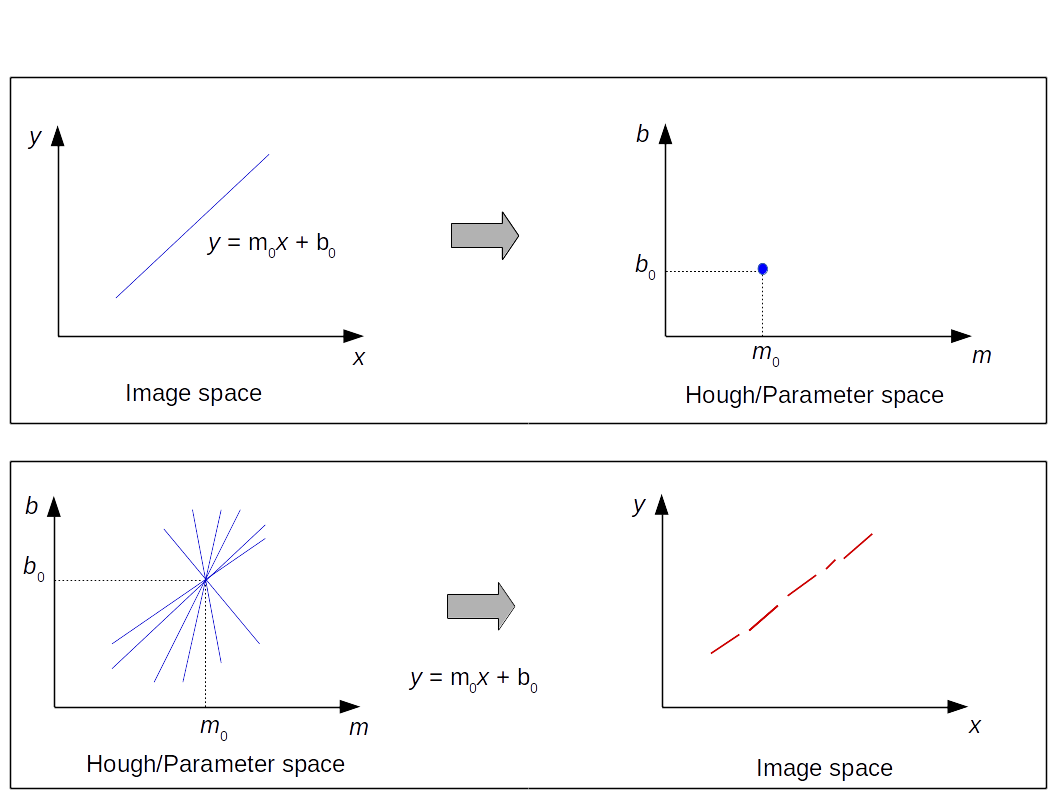
Hough Transform is used in a variety of shape-recognition applications. The Hough transform converts a line from image space to a point in Hough space.
In the example below, in the Hough space, the 2 lines intersect at the point . In the image space corresponds to a line of slope and intercept : a line made of mini-segments close to the same line equation in image space.
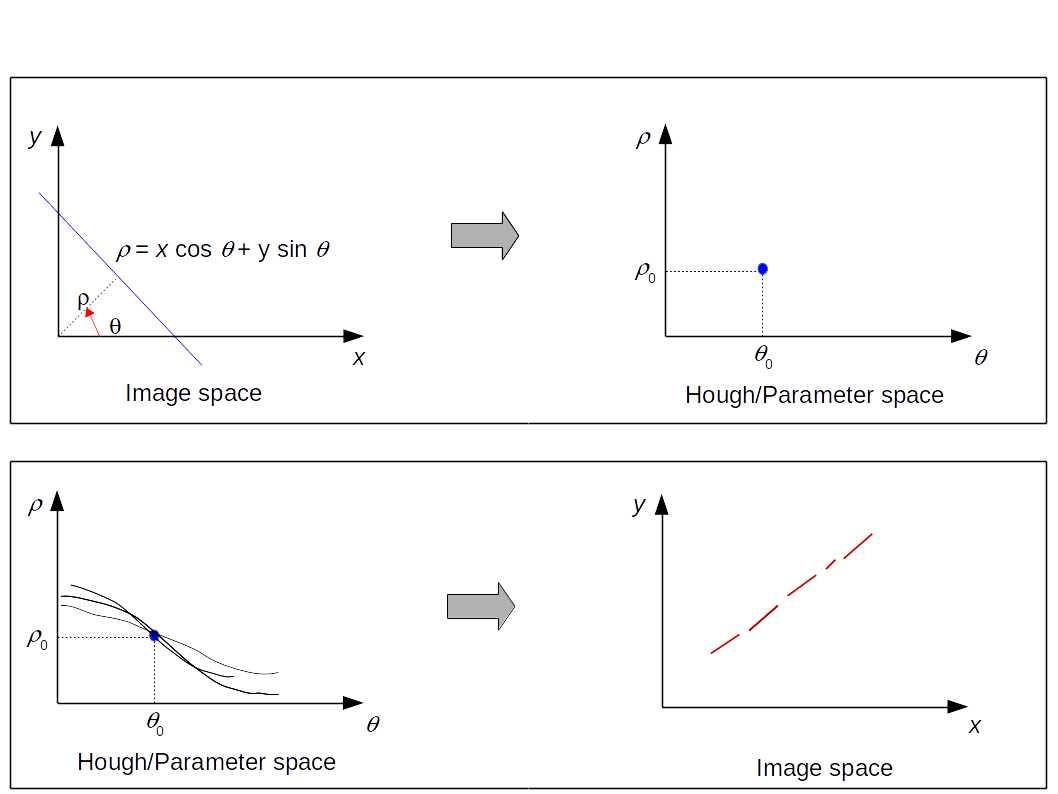
Hough Space in polar coordinate
Probabilistic Hough Transform
import cv2
import numpy as numpy
import matplotlib.pyplot as plt
# open image as grayscale
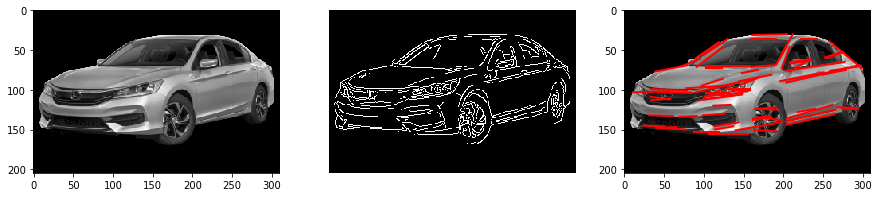
gray = cv2.imread("car.png", 0)
edges = cv2.Canny(gray,120,250,apertureSize = 3)
rho = 1 #resolution in pixel of the detection
theta = np.pi/180.
#minimum threshold to find a line number of hough space intersection it takes to find a line
threshold = 40
min_lines_length = 20
max_line_gap = 5 #gap between discontinuous line segment
lines = cv2.HoughLinesP(edges, rho, theta, threshold, np.array([]), min_lines_length, max_line_gap)
plt.figure(figsize=(15, 10))
plt.subplot(131)
plt.imshow(gray, cmap="gray")
plt.subplot(132)
plt.imshow(edges, cmap="gray")
plt.axis("off")
plt.subplot(133)
for line in lines:
plt.imshow(gray, cmap="gray")
plt.plot([line[0,0], line[0,2]], [line[0,1], line[0,3]], color="red", linewidth=2.0)
plt.show()
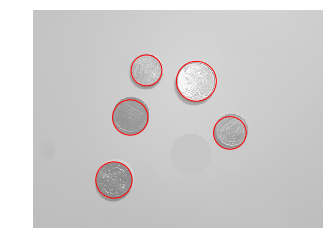
Hough Circles Detection
import cv2
import numpy as numpy
import matplotlib.pyplot as plt

# open image as grayscale
gray = cv2.imread("coin.png", 0)

"""
cv2.HOUGH_GRADIENT: detection method
dp = 1: resolution factor between the detection and image
minDist = minimum between circles (5)
param1: higher value for performing Canny edge detection (190)
param2: threshold for circle detection (small value => more circles will be detected.) (280)
minRadius: 30
maxRadius: 50
"""
circles = cv2.HoughCircles(gray, cv2.HOUGH_GRADIENT, dp=1, minDist=15, param1=120, param2=73, minRadius=30, maxRadius=100)
circles = np.round(circles[0, :]).astype("int")

fig=plt.figure(1)
ax=fig.add_subplot(1,1,1)
# loop over the (x, y) coordinates and radius of the circles
for x, y, r in circles:
    # draw the circle in the output image, then draw a rectangle
    # corresponding to the center of the circle
    circ = plt.Circle((x, y), r, color='red', fill=False)
    ax.add_patch(circ)
ax.imshow(gray, cmap="gray", alpha=0.5)
ax.axis("off")
plt.show()