High Pass Filters: edge detection
Edge Detectors
The High Pass Filters are commonly used for:
-
sharpen an image: emphasize edges
-
enhance high frequency parts of an image
Below is an example of a High Pass Filter of size :
| 0 | -1 | 0 |
|---|---|---|
| -1 | 4 | -1 |
| 0 | -1 | 0 |
The filter computes the difference or change between neighboring pixels in the image, with more weights for the center pixel. The elements of the filter sum to zero: . It enables to output 0 if the pixel intensity in the window is uniform.
The filter is applied to the image . it is said that image is convolved with kernel :
where * stands for a convolve operation, and R(x, y) is the output image.
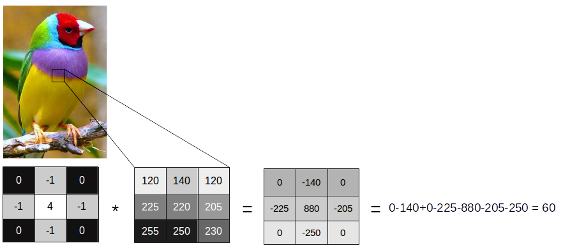
The small value, 60, means that a small edge has been detected.
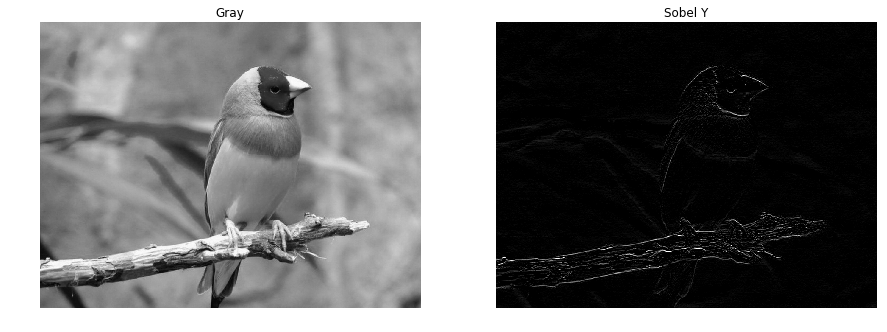
Sobel operators
- Edge detection along the
yaxis:sobel_y.
| -1 | -2 | -1 |
|---|---|---|
| 0 | 0 | 0 |
| 1 | 2 | 1 |
The kernel below compares the intensity at the top to the intensity at the bottom.
- Edge detection along the
xaxis:sobel_x
| -1 | 0 | 1 |
|---|---|---|
| -2 | 0 | 2 |
| -1 | 0 | 1 |
import cv2
import numpy as numpy
import matplotlib.pyplot as plt
# open image as grayscale
gray = cv2.imread("birds.jpg", 0)

sobel_x = np.array([[-1, -2, -1],[0, 0, 0],[1, 2, 1]])
edges = cv2.filter2D(gray, -1, sobel_x) # (input_gray, output_type[-1: same as input], kernel)

plt.figure(figsize=(15, 10))
plt.subplot(121)
plt.title("Gray")
plt.imshow(gray, cmap="gray")
plt.axis("off")

plt.subplot(122)
plt.title("Sobel Y")
plt.imshow(edges, cmap="gray")
plt.axis("off")
plt.show()
The magnitude of the detected edge (magnitude of the gradient) is given by:
The direction of the gradient is defined by:
Low Pass Filters: Noise reduction
Low Pass Filters are used to filter out high frequency noise (salt and pepper). Low Pass filter can be used to smooth out/ blur an image.
- Average filtering
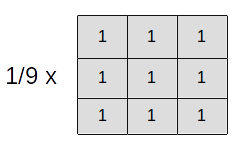
With the factor 1/9, the sum of the elements of the kernel is 1: .
- Gaussian blur
Blur enables to smooth an image, by blocking the high frequency patterns in the image, but still preserves the edge.
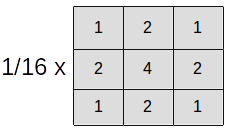
The weight at the center is highest, and the second highest weight are for the pixels with the most shared surface.
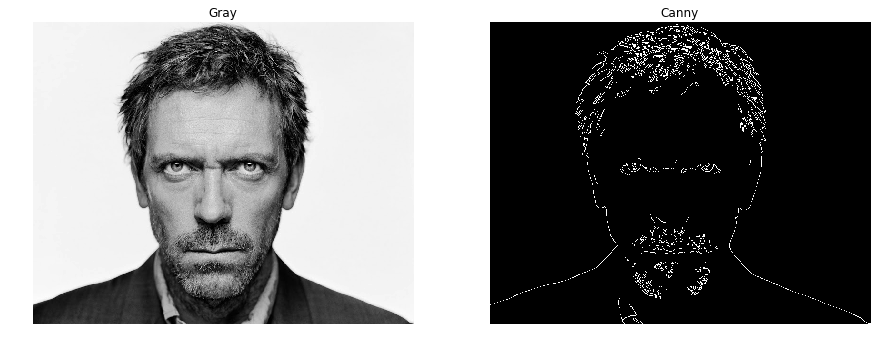
Canny Edge Detector
Canny Edge Detector is a edge detector algorithm composed of a set of operations.
-
Filters out noise using Gaussian Blur
-
Finds the strength and direction of edges using Sobel filters
-
Apply non maximum suppression to isolate the strongest edge and thin to one pixel wide lines.
-
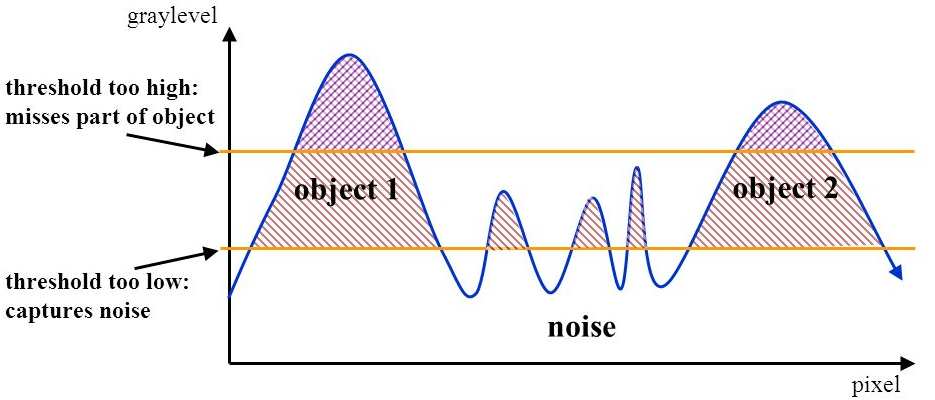
Hysteresis thresholding to isolate best edges Hysteresis thresholding is a double threshold process to eliminate weak edges and noise.
# open image as grayscale
gray = cv2.imread("birds.jpg", 0)

lower, upper = 200, 450

canny = cv2.Canny(gray, lower, upper) # (input_gray, lower_threshold_hysteresis, upper_threshold_hysteresis)

plt.title("Gray")
plt.imshow(canny, cmap="gray")
plt.axis("off")
plt.show()
It’s recommended to use lower-to-upper ratio of 1:2 or 1:3.
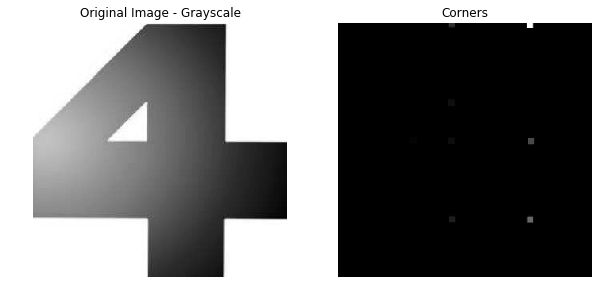
Corners Detection
Corners detection are performed using the Sobel operators: , , where:
-
Gradient magnitude:
-
Gradient direction:
Corners detection takes a window and move it up and down, right and left. If a shift of the window results in a large variation in the direction and magnitude of the gradient, that suggests the presence of a corner
import cv2
import matplotlib.pyplot as plt
import numpy as np

# open image as grayscale
gray = cv2.imread("4.jpg", 0)
gray_float = gray.astype(np.float32)

"""
Corner Detection Algorithm
	:window: 3, (3x3) pixel square of the window
	:kernel: sobel operator size
	:threshold: 0.04 - determine which points are corners. The value is typically 0.04
"""
dst = cv2.cornerHarris(gray_float, 3, 3, 0.04)
#Dilatation required for better visualization
dst = cv2.dilate(dst, None, iterations = 3)
dst = (dst - np.min(dst)) / (np.max(dst) - np.min(dst))

plt.figure(figsize=(10, 5))
plt.subplot(121)
plt.title("Original Image - Grayscale")
plt.imshow(gray, cmap="gray")
plt.axis("off")

plt.subplot(122)
plt.title("Corners")
plt.imshow(dst, cmap="gray")
plt.axis("off")
plt.show()